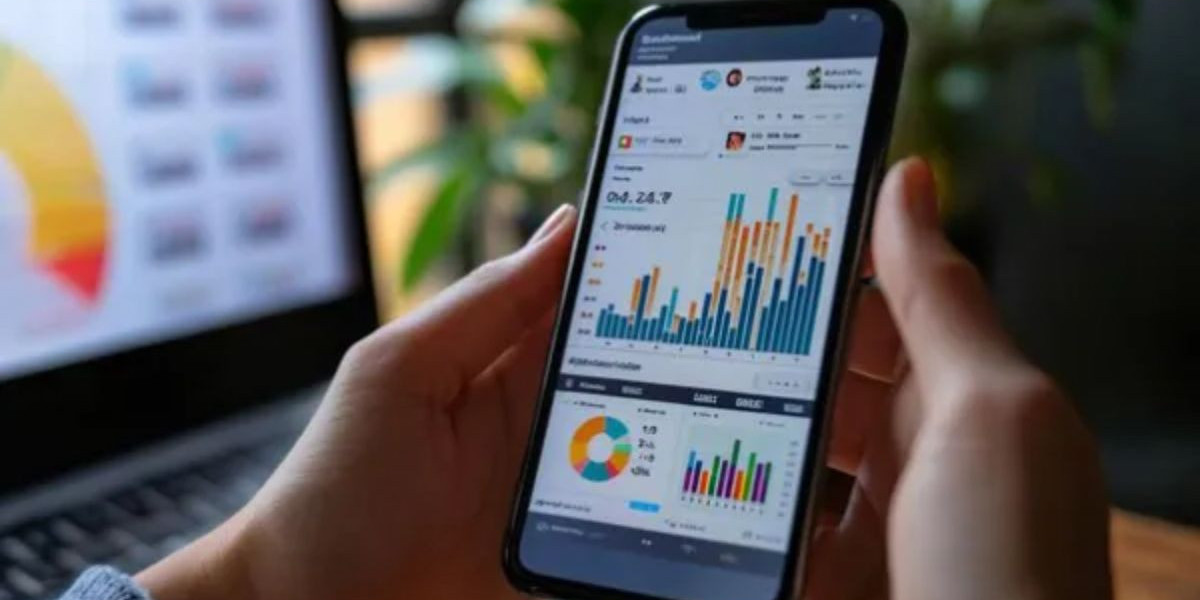
Over the last ten years, data analytics and visualization have transformed from niche capabilities into core drivers of decision-making across industries. Businesses that once relied on static reports now demand real-time insights, predictive modeling, and dynamic dashboards that empower teams at every level. With 2026 on the horizon, it is clear that data has become the new currency, and organizations that effectively harness it hold the competitive advantage.
This article explores the major trends, tools, and future prospects of data analytics and visualization. From advanced AI integration to the rise of self-service platforms, we will trace how the industry has matured and what to expect moving forward.
The Evolution of Data Analytics Over a Decade
Ten years ago, data analytics was mainly the domain of specialized IT and business intelligence teams, and for small businesses . Today, it is an enterprise-wide capability. Cloud adoption has democratized access, while open-source frameworks and commercial platforms have made analytics scalable and user-friendly.
Modern data analytics services go beyond descriptive reporting to include predictive and prescriptive analysis. Organizations can forecast market shifts, detect anomalies, and optimize processes in real time. The shift from hindsight to foresight has been the defining achievement of this decade.
Visualization as the Language of Data
If analytics is the engine, visualization is the steering wheel. The ability to translate raw data into visual formats has been critical for making insights actionable. Over the years, visualization has moved beyond simple bar charts and pie graphs into interactive dashboards, heat maps, geospatial models, and immersive 3D visuals.
Data visualization service providers have played a pivotal role by delivering platforms that enable users to explore and interact with data intuitively. This accessibility ensures decision-makers are not overwhelmed by complexity but are instead guided by clarity.
Key Trends that Shaped the Last Decade
Rise of Cloud and Hybrid Data Models
Cloud-based platforms transformed analytics from costly on-premise deployments into scalable, flexible systems. Hybrid models further allowed businesses to balance security with accessibility.
Self-Service Analytics
Organizations increasingly empower employees at all levels with self-service tools. These platforms enable non-technical users to generate insights without constant IT dependency.
Integration of AI and Machine Learning
Machine learning has moved from experimentation to mainstream adoption. AI-driven analytics allows organizations to detect hidden patterns, personalize customer experiences, and automate decision-making.
Real-Time Analytics
Businesses can no longer wait for end-of-month reports. Streaming data and real-time dashboards provide instant insights into operations, customer behavior, and market shifts.
The Expanding Role of Managed Data
Managing massive volumes of structured and unstructured data has become a major challenge. With the rise of IoT, cloud systems, and cross-platform integrations, ensuring accuracy, security, and compliance is critical.
This is where data managed services provide stability. These services streamline governance, optimize storage, and safeguard sensitive data while allowing organizations to focus on extracting value rather than maintaining infrastructure.
Tools That Defined the Landscape
Business Intelligence Platforms
Tools like Power BI, Tableau, and Qlik have dominated, offering user-friendly interfaces and strong integration with enterprise systems.
Cloud Analytics Solutions
AWS QuickSight, Google BigQuery, and Azure Synapse Analytics have enabled large-scale data processing with lower infrastructure costs.
Data Science Ecosystems
Python libraries such as Pandas, Matplotlib, and TensorFlow remain essential, supported by R and advanced frameworks for specialized modeling.
Visualization Innovations
VR and AR visualization tools are emerging, creating immersive data experiences that were once only theoretical.
Future Prospects in 2026 and Beyond
Predictive and Prescriptive Expansion
Organizations will not only predict outcomes but also receive automated recommendations on actions to take.
Ethical AI and Responsible Data Use
With increasing reliance on AI, the demand for transparency, fairness, and ethical data use will be non-negotiable.
Democratization of Analytics
By 2026, every employee in a data-driven organization will have some form of analytics embedded in their daily workflow.
Advanced Automation
Data pipelines will be increasingly automated, reducing human error and accelerating insights.
The Convergence of IoT and Analytics
As IoT expands, analytics platforms will integrate seamlessly with billions of connected devices, driving innovation in industries from healthcare to logistics.
Challenges Ahead
While progress is undeniable, challenges persist. Data privacy regulations are becoming stricter worldwide, requiring organizations to adapt. The shortage of skilled data professionals remains a bottleneck. Moreover, over-reliance on automation without oversight could introduce risks. Addressing these hurdles is essential for sustainable growth.
Why the Last Decade Matters
Looking back helps organizations prepare for what is next. The last ten years have shown that companies that adopted analytics early outperformed their peers significantly. Investments in visualization, governance, and automation will continue to yield long-term returns. As 2026 approaches, embracing these technologies is less about choice and more about survival.
Frequently Asked Questions
What is the biggest change in data analytics over the past decade?
The shift from descriptive to predictive and prescriptive analytics has been the most significant evolution, enabling proactive rather than reactive strategies.
Why is data visualization important?
Visualization makes complex datasets comprehensible, ensuring decision-makers can act quickly and accurately.
What role does AI play in data analytics?
AI enhances analytics by detecting patterns, automating predictions, and generating actionable insights that humans might overlook.
How will analytics evolve by 2026?
Expect deeper integration of AI, more immersive visualization, wider democratization, and stronger emphasis on data ethics and privacy.
Do all businesses need managed data services?
Yes. With growing data complexity, managed services help maintain compliance, security, and efficiency while focusing on innovation organizations.
Conclusion
The journey of data analytics and visualization has been nothing short of revolutionary. What began as a specialized capability has become the foundation of modern business strategy. The decade ahead promises even more transformation, with automation, AI, and immersive technologies taking center stage. Organizations that align with these changes will not just survive but thrive in the data-driven economy.


