
In the complex ecosystem of modern business, a Business Analyst (BA) acts as a translator. They must speak the language of the C-suite (ROI and strategy), the language of the developer (logic and constraints), and the language of the end-user (functionality and ease of use). When words fail—or when they lead to confusing, 100-page documents—the BA reaches for their most powerful weapon: the diagram.
Visualizing requirements is not just a secondary task; it is a core component of effective Data Visualization. By mapping out processes, data flows, and system architectures, a BA can spot gaps that text alone would never reveal. In 2026, as business processes become more automated and data-heavy, mastering these ten diagrams is no longer optional—it is the baseline for professional success.
Why Visual Documentation Wins
A diagram can communicate in a single glance what might take twenty minutes to explain verbally. For the BA, diagrams serve as a "single source of truth." They reduce ambiguity, facilitate faster sign-offs from stakeholders, and provide a clear roadmap for the technical team.
Furthermore, as analysts aim for higher-tier roles, the ability to select the right visual for the right problem becomes a key differentiator. Many who seek Certifications for Business Analysts find that a deep dive into modeling languages like BPMN or UML is what truly bridges the gap between a junior role and a lead consultancy position.
1. Process Flowchart (BPMN)
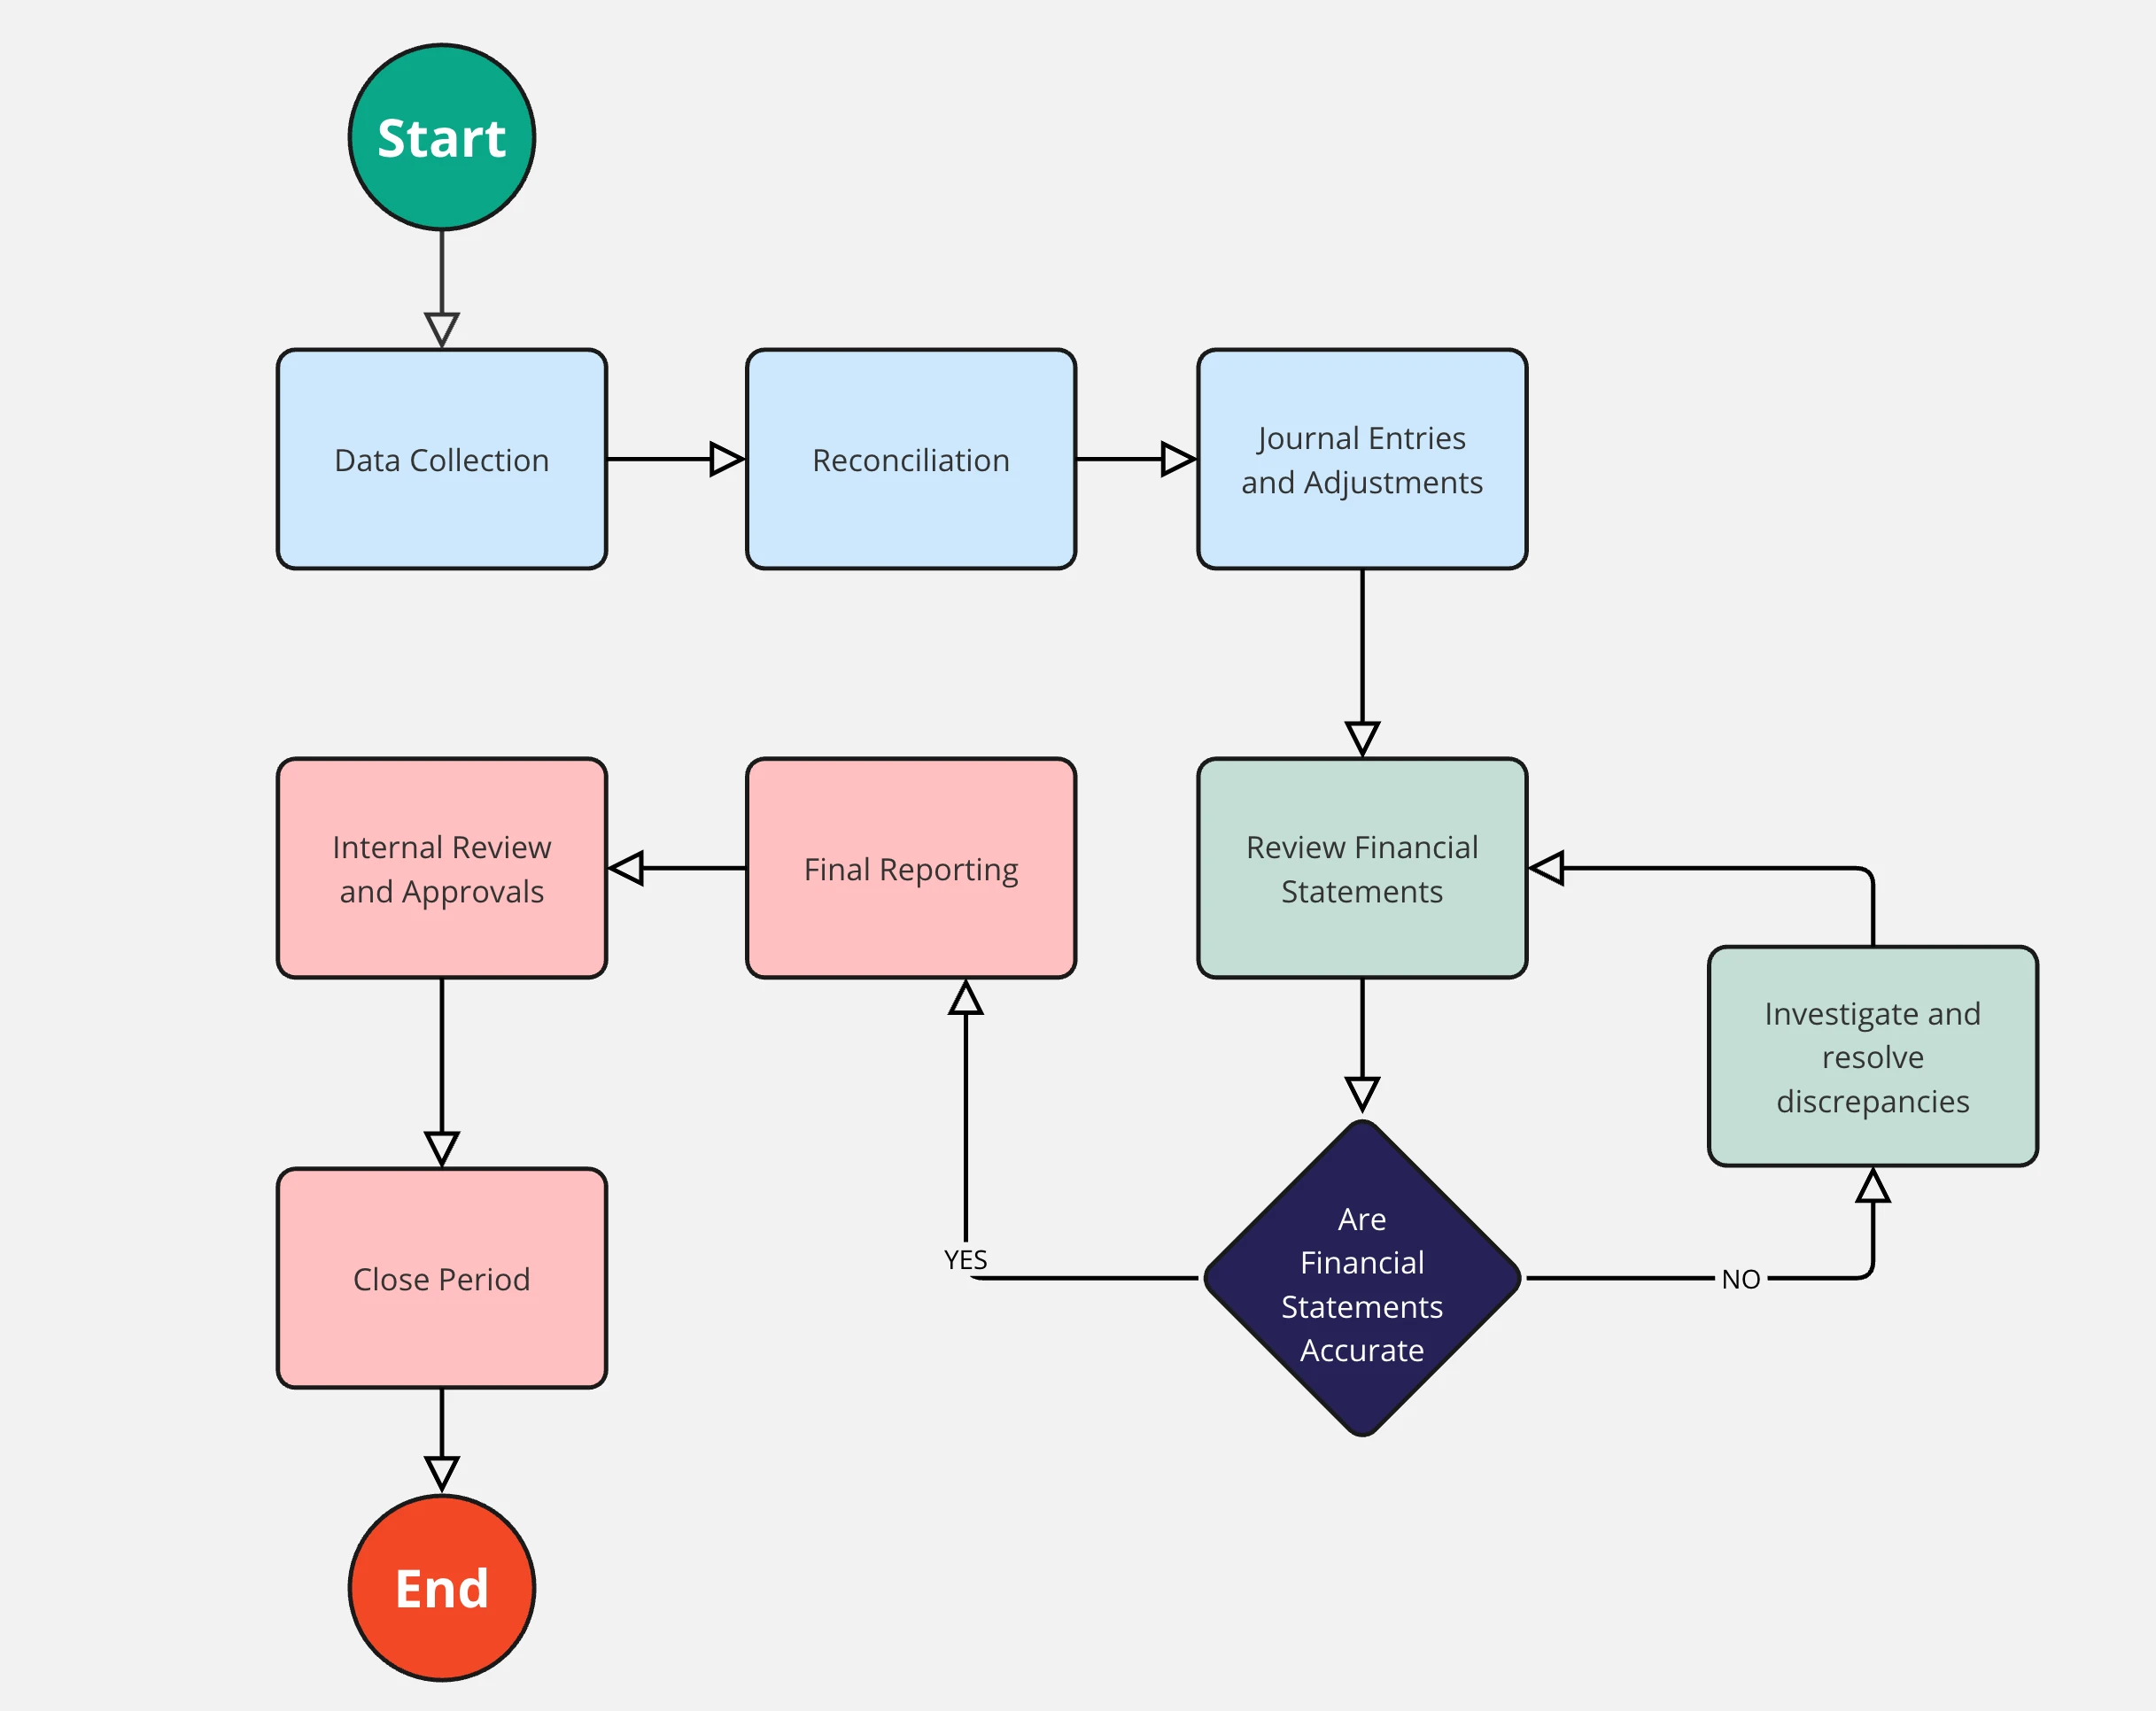
The "bread and butter" of business analysis. A flowchart maps out a business process from start to finish. Using Business Process Model and Notation (BPMN) ensures that your "swimlanes" (which show who does what) and "gateways" (decision points) are standardized and universally understood.
2. Use Case Diagram
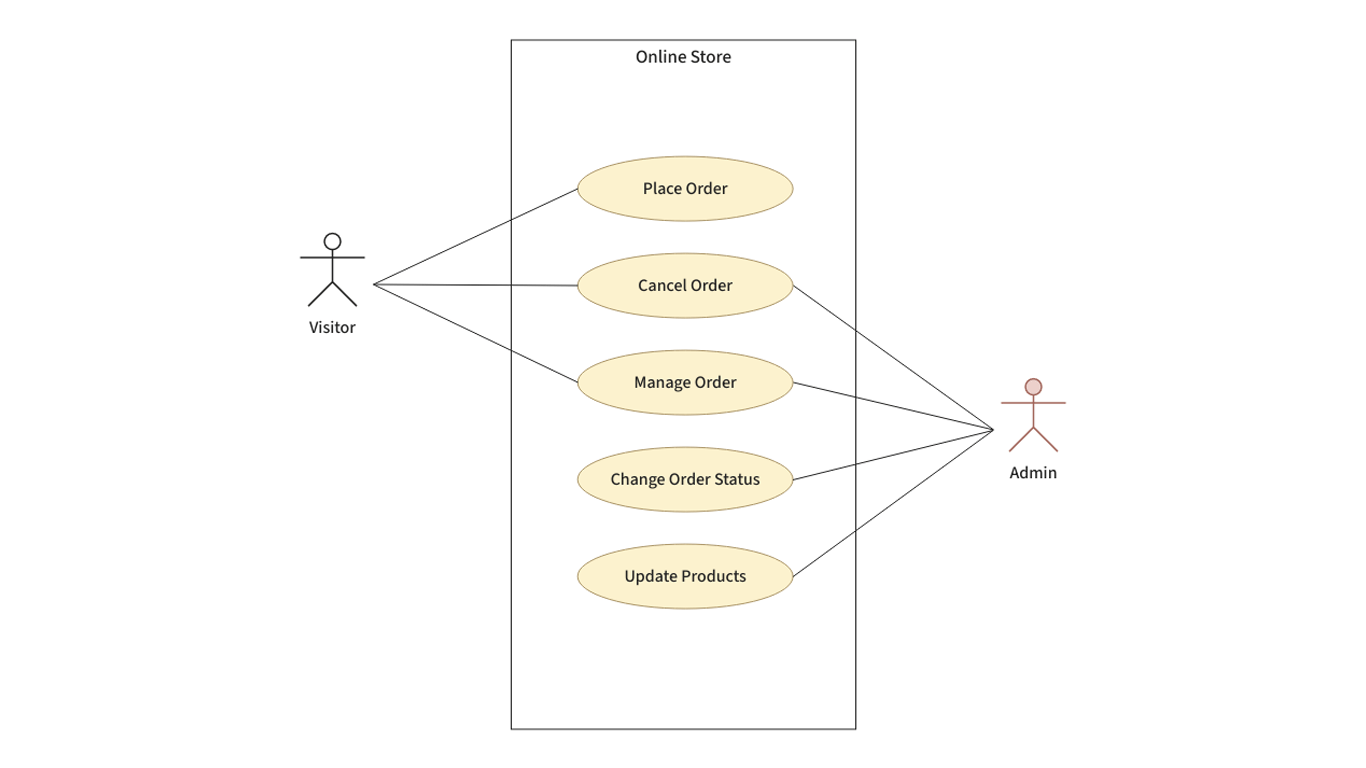
This diagram focuses on the who and the what. It shows the relationship between "Actors" (users or external systems) and the "Use Cases" (the specific goals they are trying to achieve). It defines the scope of the system at a high level without getting bogged down in technical "how-to."
3. Data Flow Diagram (DFD)
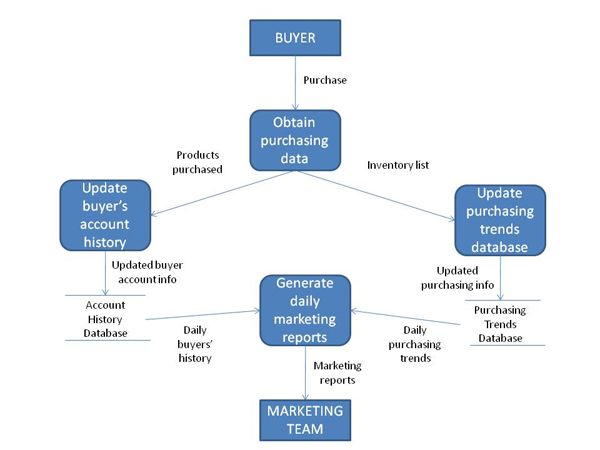
In the realm of Data Visualization, the DFD is essential for understanding how information moves through a system. It tracks where data comes from, where it goes, and how it is stored. This is particularly vital in 2026 for analysts working on GDPR compliance or data security projects.
4. Entity-Relationship Diagram (ERD)
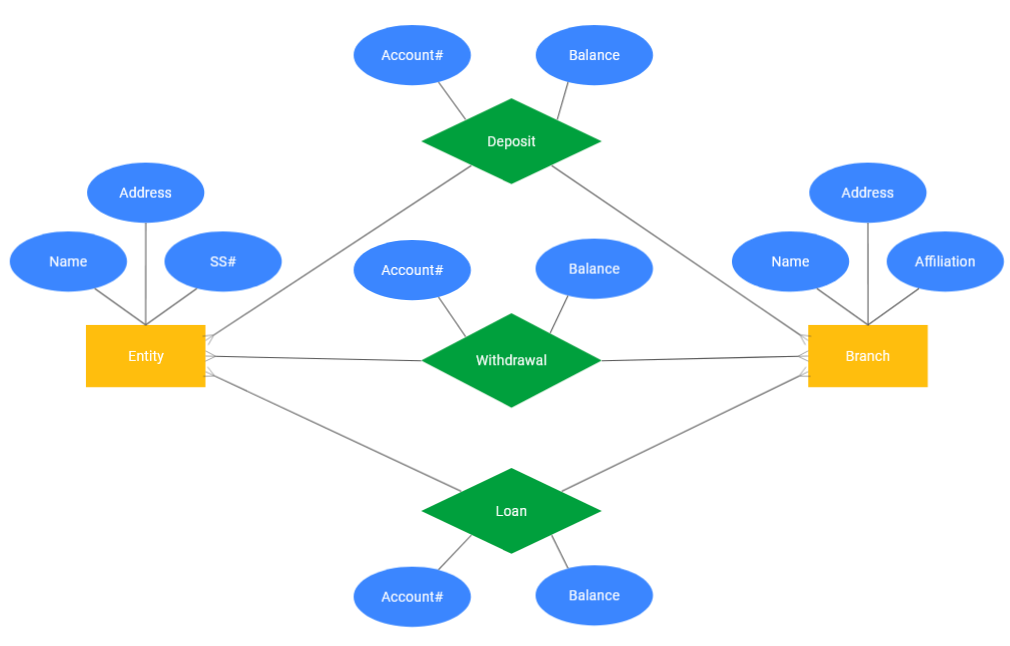
The ERD is the blueprint for a database. It shows the "entities" (like Customers, Orders, or Products) and how they relate to one another (e.g., one customer can have many orders). For a BA, understanding the ERD is crucial when discussing technical constraints with database administrators.
5. Sequence Diagram

When you need to show the logic of a process over time, a Sequence Diagram is the tool of choice. It maps out the chronological interaction between different objects or systems. This is indispensable for documenting complex API integrations or automated workflows.
6. Activity Diagram

Think of this as a flowchart on steroids. Activity diagrams are used to model the dynamic aspects of a system. They are particularly useful for showing parallel activities—things that happen at the same time—and complex conditional logic that a standard flowchart might struggle to represent.
7. State Machine Diagram

Not every system is a simple flow; some systems exist in "states." For example, an order in an e-commerce system might be "Pending," "Shipped," or "Cancelled." A State Machine Diagram tracks these transitions and the triggers that cause them, ensuring no logic gaps exist in the lifecycle of an object.
8. SWOT Analysis Diagram

Business analysis isn't always about software; it’s about strategy. The SWOT (Strengths, Weaknesses, Opportunities, Threats) diagram helps stakeholders visualize the internal and external factors affecting a project. It is a staple of the discovery phase.
9. Fishbone (Ishikawa) Diagram
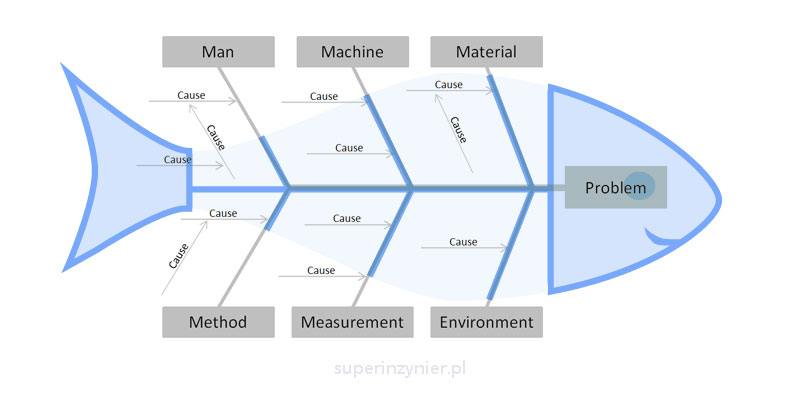
When a project hits a snag, the BA becomes a root-cause investigator. The Fishbone diagram helps teams brainstorm and categorize the potential causes of a problem (e.g., People, Methods, Machines, Materials) to find the source of a defect or inefficiency.
10. SIPOC Diagram

Used in Lean and Six Sigma, SIPOC stands for Suppliers, Inputs, Process, Outputs, and Customers. This high-level diagram is perfect for the very start of a project to define the boundaries of the "Guide to Requirements Gathering" and ensure no key stakeholders are forgotten.
Mastering the Visual Narrative
Knowing which diagram to use is just half the battle. The other half is ensuring they are part of a cohesive Data Visualization strategy. A common mistake among junior analysts is "over-modeling"—creating complex diagrams for simple processes that don't require them.
The "Modern BA" knows that the goal isn't to draw the most complex picture; it's to provide the most clarity.
Leveraging Tools and Tech
In 2026, we are seeing a shift toward AI-assisted diagramming. Tools like Lucidchart, Miro, and Visio now offer features that can generate initial drafts of flowcharts or ERDs from text descriptions. However, the human BA is still required to validate the logic and ensure the diagram aligns with the business's strategic goals.
The Value of Certification
Because the industry is moving toward standardized modeling languages (like UML 2.5), informal "sketching" is no longer enough for enterprise-level projects. This is a primary driver for professionals pursuing Certifications for Business Analysts. These credentials prove to employers that you can produce industry-standard documentation that technical teams can trust without second-guessing.
Conclusion: Turning Diagrams into Decisions
The diagrams in your toolkit are more than just pictures; they are the artifacts that turn a vague "business idea" into a functioning reality. Whether you are using a DFD to explain data privacy to a stakeholder or a Sequence Diagram to troubleshoot an integration with a developer, you are using Data Visualization to drive the project forward.
As you build your career, don't just collect these diagrams—master the nuances of when and where to deploy them. By combining these visual skills with the rigorous standards taught in professional Certifications for Business Analysts, you will transform yourself from a documenter of requirements into an architect of business solutions.
The next time you find yourself in a meeting where everyone is talking in circles, step up to the whiteboard. Draw a box, draw an arrow, and watch the chaos turn into clarity.